

Powerfully Analyze Your Business Standings with New Insights Filters and Aggregates 📈
We have just added new filters within your Insights page, allowing you to compare stats to previous periods and aggregate numbers based on what you need 🌟
Having a clear picture of key metrics within your business is instrumental if you want to have a healthy, growing company. As you and your team add in new initiatives to work toward specific goals, it is vital that you are able to track and compare different numbers over time to see what is working (or not working). This is why we’ve just added in new compare to and aggregation filters within your Business Insights page — so you can track, compare and analyze your top metrics in the most efficient and effective ways!
💥 Business Insights — What’s New
Find these new compare to and aggregation filters within your Insights page (Analytics > Insights). Your Insights page has a variety of charts, graphs and analytical summaries of important numbers within your business, such as total sales, total visits, customer retention and more. You have the ability to view these numbers by different date ranges — daily, monthly, yearly, or any custom dates you choose. Now, you also have the option to choose what dates you want to compare these metrics to (i.e. previous period, previous month, etc) and how you want the numbers aggregated (ie daily, weekly or monthly).
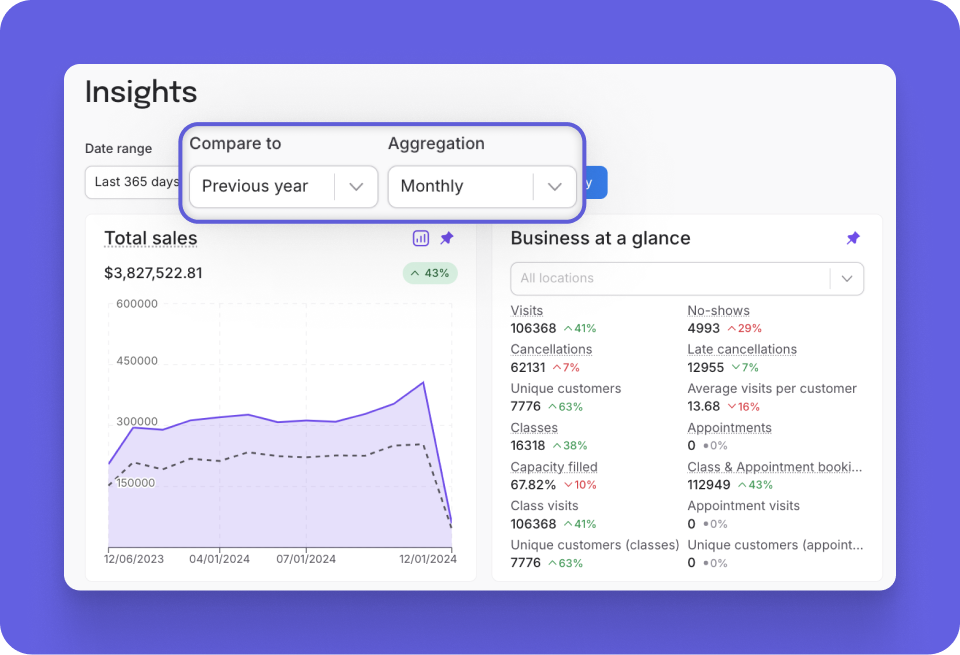
💥 Compare To Filter
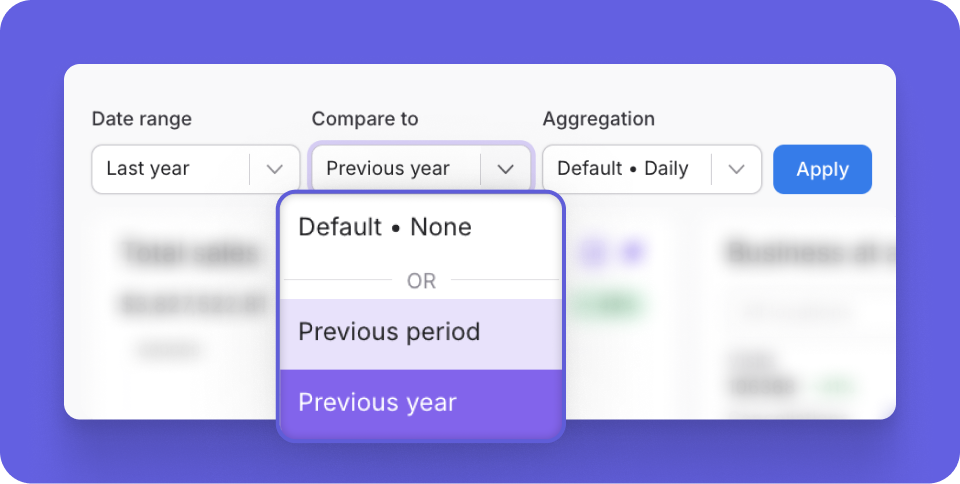
After you select the date range you want to view your insights for, you can now select what you want to compare to. For example, let’s say you are pulling your insights for last quarter to see how your numbers changed throughout a 3 month period. You could choose to compare to the previous year or previous period. The previous period would give you the quarter before, or the previous year would give you year-over-year numbers.
💥 Aggregation Filter
Next, you have the ability to select the Aggregation that you’d like to view your numbers by. This allows you to see your metrics in a more digestible and effective way, depending on that range you pulled. For example, if you selected the date range of last year, you likely want to see your total numbers grouped by month, versus seeing the daily stats. Whereas if you were pulling just one month’s numbers, a daily or weekly aggregate might be more helpful.

💥 How to Read the Numbers
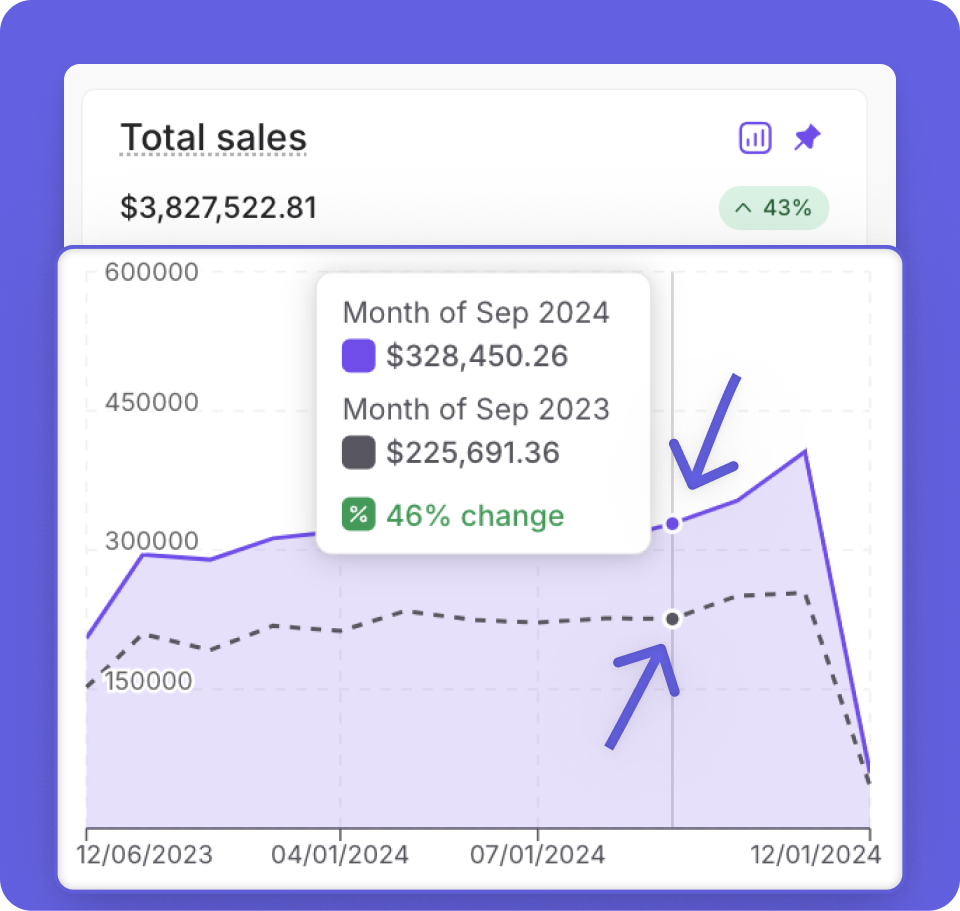
Once you’ve set the date range, compare to and aggregation filters, all of the insights will pull based on your selection. You can easily hover over any point within one of the graphs or tables to see the specifics. For example, the graph below shows the total sales numbers based on the range of last 365 days, with a comparison to the previous year and an aggregation of monthly. You can see that we have hovered over one of the spots on the graph to see the month of September for this year, and the comparison to the previous year (dotted line) as well as the percentage change (46% increase in this case).
To begin using the new Insights filters, navigate to: Analytics > Insights from your dashboard!
Want some extra knowledge about this feature and/or other new releases? Join one of our Q&A: Marketing and New Feature Releases webinars happening twice weekly.
Enjoying this or any of our new features? We’d love to hear! Email success@momence.com with your feedback 🌟
Want to learn more about this and other great Momence features? Check out our FAQ page or book a demo today.
Already a Momence user and want to know more?
💜,
The Momence Team